Wipro Q4 & FY2026 Results: Profit Growth, Buyback Plan & What It Means for Investors
🏢 Overview
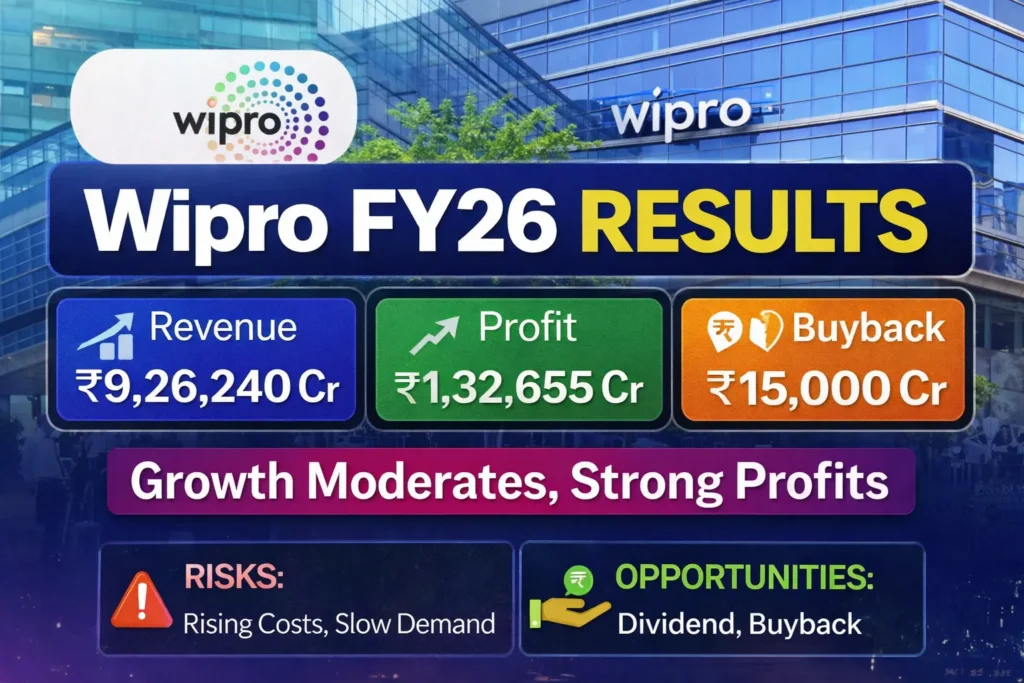
IT giant Wipro Limited has announced its Q4 and full-year financial results for FY2026, along with a major corporate action — a ₹15,000 crore share buyback.
The results reflect steady revenue growth, improving profitability, and strong cash flows, but also highlight some cost pressures and global business challenges.
📈 Key Financial Highlights (FY2026)
According to the official filing :
💰 Revenue Growth
- Standalone Revenue: ₹7,13,451 million (₹71,345 crore)
- Previous Year: ₹6,85,750 million
- 📊 Growth: ~4%
- Consolidated Revenue: ₹9,26,240 million (₹92,624 crore)
- Previous Year: ₹8,90,884 million
- 📊 Growth: ~4%
👉 Insight: Wipro is growing steadily, but not aggressively compared to some peers.
📊 Profit Performance
- Standalone Net Profit: ₹1,21,296 million
- Previous Year: ₹1,09,131 million
- 📈 Growth: ~11%
- Consolidated Net Profit: ₹1,32,655 million
- Previous Year: ₹1,32,180 million
- 📈 Growth: Marginal (~0.4%)
👉 Insight: Profit growth exists, but consolidated level shows stagnation, hinting at global pressure.
📉 Quarterly (Q4 FY2026) Snapshot
- Revenue: ₹2,42,363 million
- Net Profit: ₹35,216 million
👉 Compared to last year’s quarter, profit remained largely stable.
💸 Expenses Breakdown (What’s Impacting Margins?)
From the detailed statement (Page 5):
Major cost drivers include:
- Employee Benefits: ₹3,88,809 million (largest expense)
- Subcontracting Costs: ₹1,26,442 million
- Finance & Depreciation Costs: Rising trend
👉 Key Insight:
Wipro’s margins are under pressure due to:
- High employee costs
- Increasing outsourcing/subcontracting
📊 Earnings Per Share (EPS)
- Standalone EPS (FY2026): ₹11.59
- Consolidated EPS: ₹12.60
👉 Slight improvement from last year, indicating better shareholder returns.
🔄 Major Announcement: ₹15,000 Crore Buyback
One of the biggest highlights:
- Buyback Size: ₹15,000 crore
- Price: ₹250 per share
- Shares: Up to 600 million (5.7% equity)
📌 As per the document (Page 8)
👉 Why this matters:
- Signals strong cash position
- Boosts investor confidence
- Improves EPS and shareholder value
💵 Dividend Update
- Total interim dividend: ₹11 per share
- ₹5 (July 2025)
- ₹6 (Jan 2026)
👉 Consistent dividend = stable income for investors
🏦 Balance Sheet Strength
- Total Assets: ₹9,73,424 million
- Strong increase in:
- Investments
- Cash reserves
- Financial assets
👉 Indicates strong liquidity and expansion capacity.
💰 Cash Flow Analysis
- Operating Cash Flow: ₹95,708 million
- Healthy cash generation despite:
- High investments
- Dividend payouts
👉 Strong cash flow = financial stability + future growth potential
⚖️ Auditor’s Opinion
- Audit conducted by Deloitte Haskins & Sells LLP
- Verdict: ✅ “True and Fair View” (Unmodified Opinion)
👉 This confirms:
- No major accounting issues
- Reliable financial reporting
⚠️ Important Developments
1. Merger of Subsidiaries
- Multiple Wipro subsidiaries merged into parent company
- Effective from April 2025
👉 Improves operational efficiency
2. Labour Code Impact
- New labour laws increased employee benefit costs
- Impact: ₹2,562 million additional expense
👉 Regulatory changes affecting profitability
📊 Overall Analysis: Bullish or Bearish?
✅ Positives
✔ Consistent revenue growth
✔ Profit improvement (standalone)
✔ Strong cash flow
✔ Massive buyback announcement
✔ Stable dividends
⚠️ Concerns
❗ Slow consolidated profit growth
❗ Rising employee & subcontracting costs
❗ Global IT demand uncertainty
🧠 Final Verdict
Wipro’s FY2026 results show a stable but not aggressive growth story.
👉 It’s a “Defensive IT Stock” right now:
- Strong fundamentals
- Shareholder-friendly actions (buyback + dividend)
- But limited high-growth signals
📢 Disclaimer
This article is for educational and informational purposes only. It is based on publicly available financial data from Wipro’s official filing .
Not financial advice. Please consult a financial advisor before making investment decisions.