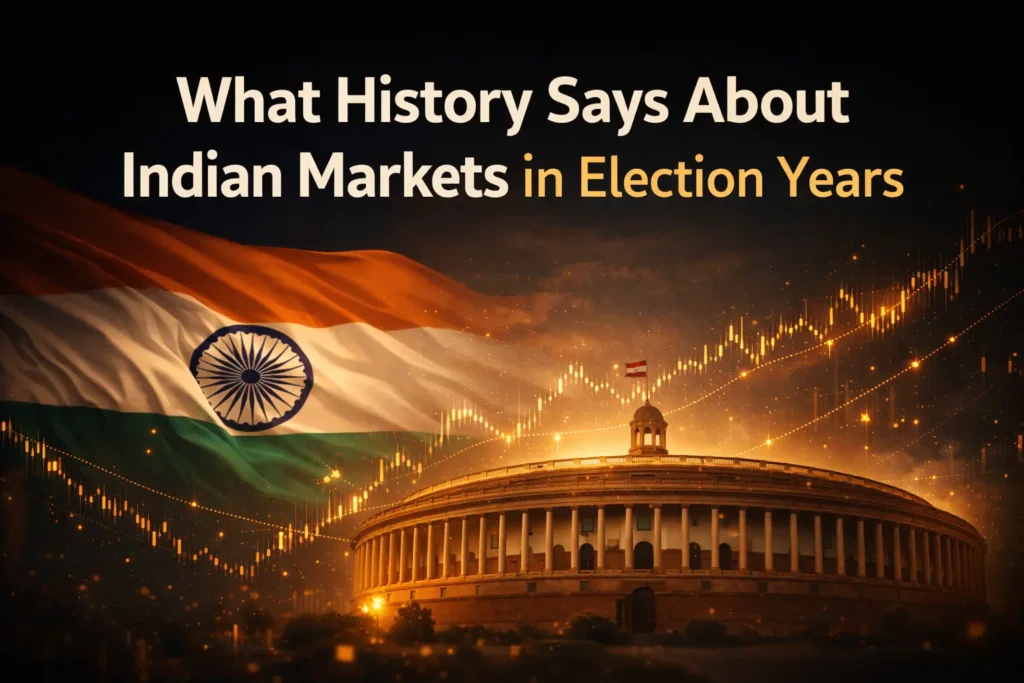
What History Says About Indian Markets in Election Years
Do Indian stock markets always rise during election years? Here is what the actual historical data says — and what every Indian investor must know before the next big election cycle.
Every five years, India goes through a transformation.
The world’s largest democracy — over 960 million eligible voters, thousands of constituencies, weeks of polling across a subcontinent — conducts a general election that determines who will govern the country for the next half decade.
And every five years, the same questions flood Indian financial media, investor WhatsApp groups, and brokerage research reports.
Will markets rally before the election? Will they crash after? Should you buy now or wait? Is this government good or bad for stocks? What happens if there is a hung parliament?
The noise around Indian elections and stock markets is enormous. The quality of that noise — the actual data, the real historical patterns, the honest analysis of what elections actually do to Indian equity returns — is surprisingly thin.
Most of what gets said about Indian markets and elections is opinion dressed as analysis. Selective memory presented as pattern recognition. Political preference masquerading as investment insight.
This article cuts through all of that.
What follows is an honest, data-grounded examination of what Indian stock market history actually shows about election years — the patterns that are real, the ones that are overstated, the ones that are outright myths, and what all of it means for how you should think about your portfolio during India’s most politically charged periods.
Setting the Stage — India’s Election Calendar
Before examining market behaviour, it helps to understand the structure of Indian elections that creates the periodic uncertainty markets must price.
India holds General Elections — Lok Sabha elections — every five years to determine the composition of the lower house of Parliament and therefore the formation of the central government. The Prime Minister and cabinet are drawn from whichever party or coalition commands a majority in the Lok Sabha.
These General Elections have been held in 1984, 1989, 1991, 1996, 1998, 1999, 2004, 2009, 2014, 2019, and most recently 2024 — with some elections held ahead of schedule due to coalition collapses.
Beyond General Elections, India holds State Assembly Elections continuously across its 28 states and 8 Union Territories — on staggered schedules that mean some politically significant state is almost always in election mode. Major state elections — particularly in large states like Uttar Pradesh, Maharashtra, West Bengal, and Tamil Nadu — can move markets in the short term even outside of General Election years.
The market impact analysis in this article focuses primarily on General Elections — where the stakes, the uncertainty, and the historical data are most significant.
The Broad Historical Pattern — What the Data Shows
Let us start with the most important question: do Indian stock markets actually perform differently during election years compared to non-election years?
The honest answer is — yes, but not in the simple, directional way most people expect.
Looking across India’s General Election cycles since liberalisation in 1991 — the period during which Indian equity markets became genuinely significant and data-meaningful — a clear but nuanced pattern emerges.
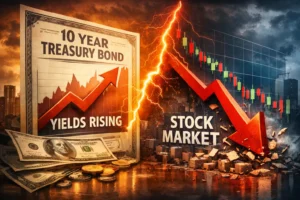
Election years are characterised by elevated volatility — not necessarily negative returns.
The defining characteristic of Indian markets during General Election years is not that they go up or go down. It is that they swing more dramatically than in non-election years — experiencing sharper rallies and sharper corrections within the same 12-month period.
The Sensex or Nifty in an election year typically experiences its full range of outcomes more intensely than in a typical year. Bull runs are sharper. Corrections are steeper. The distance between the year’s high and the year’s low is wider. Volatility — as measured by India VIX — is consistently elevated during election campaign periods and around result announcement days.
This volatility pattern creates both risk and opportunity — and understanding it is far more useful than any simple “buy before elections” or “sell after results” rule.
Election Year By Election Year — The Historical Record
Rather than speaking in generalities, let us examine what Indian markets actually did during each major General Election cycle since liberalisation.
1991 — The Liberalisation Election
The 1991 General Election occurred during one of India’s most severe economic crises — a balance of payments emergency that brought the country to the edge of sovereign default.
The election itself produced a minority Congress government under PV Narasimha Rao following the assassination of Rajiv Gandhi during the campaign. The government that emerged — with Manmohan Singh as Finance Minister — unleashed India’s historic economic liberalisation program.
Indian markets — then in their early post-liberalisation infancy — responded with extraordinary enthusiasm to the reform program. This election cycle is historically unique because the economic policy response to the crisis was so transformative that it essentially reset India’s growth trajectory — making the market impact of the election itself secondary to the policy revolution that followed it.
Key lesson: The most important elections for markets are not always the ones where the result itself is most predictable. Sometimes the policies that emerge from an election — policies that nobody fully anticipated — are what drive market outcomes.
1996 and 1998-1999 — The Coalition Chaos Years
The mid to late 1990s were India’s most politically unstable period since liberalisation — producing three general elections in four years as coalition governments collapsed repeatedly.
The 1996 election produced a hung parliament. The subsequent coalition government collapsed. The 1998 election produced another coalition. That government survived for 13 months before a single vote of no-confidence brought it down. The 1999 election finally produced a stable coalition that served a full term.
Indian markets during this period of political instability were volatile and ultimately range-bound. The uncertainty about government stability — whether any coalition would last long enough to implement meaningful policy — created persistent investor hesitation about making long-term bets on India’s economic direction.
Key lesson: Political instability and coalition uncertainty are genuinely negative for Indian equity markets — not because markets prefer any particular political ideology, but because policy continuity and economic reform momentum require stable governments with clear mandates. Hung parliament outcomes have historically been associated with market weakness.
2004 — The Shock Result
The 2004 General Election produced one of the most dramatic single-day market events in Indian history — and its lessons are essential for understanding how markets price election uncertainty.
Going into the 2004 election, the incumbent NDA government led by Atal Bihari Vajpayee was widely expected to win — buoyed by the India Shining economic narrative and strong pre-election poll numbers. The BSE Sensex had been rising in the weeks before results, pricing in an expected NDA victory and the economic policy continuity it represented.
The actual result was a stunning defeat for the NDA and victory for the Congress-led UPA coalition — a result that almost no pre-election survey had accurately predicted.
The market reaction on result day was one of the worst single-day crashes in Indian market history. The Sensex fell approximately 15 percent on the day results became clear — triggering circuit breakers that halted trading. Panic was widespread.
The reason for the crash was not that markets had a political preference for NDA over UPA. It was that markets had priced in continuity and certainty — and the actual result delivered surprise and uncertainty about which coalition partners the Congress would include and what their economic policies would be.
Within months, as the UPA government’s economic policies became clearer and proved to be broadly market-friendly, Indian markets recovered. The Sensex went on to deliver extraordinary returns between 2004 and 2007 — one of the greatest Indian equity bull markets in history.
Key lesson — and it is perhaps the most important one in this entire article:
Markets do not price in which party wins. Markets price in certainty versus uncertainty. An expected result — regardless of which party wins — is absorbed calmly. An unexpected result — even one that ultimately proves positive for markets — creates immediate sharp volatility as markets reprice uncertainty.
The 2004 episode is also the most powerful warning against making large directional bets on election outcomes. The consensus was completely wrong. The market’s confident pre-election positioning was completely wrong. And investors who panicked and sold at the circuit-breaker lows missed one of India’s greatest bull market runs.
2009 — The Surprise Mandate
The 2009 election produced the opposite dynamic to 2004 — and the market reaction was the mirror image.
Going into 2009 results, pre-election surveys suggested a close contest and likely hung parliament. Markets were cautious. The global financial crisis had devastated Indian equities through 2008 — the Sensex had fallen from 21,000 to below 8,000 — and investor sentiment was deeply pessimistic.
The actual result was a decisive mandate for the Congress-led UPA — a stronger majority than almost anyone had expected. The clarity and decisiveness of the mandate — eliminating hung parliament fears — triggered a historic single-day rally.
The Sensex rose approximately 17 percent on the day of the 2009 result — the largest single-day gain in Indian market history. Upper circuit breakers were triggered. Trading was halted as the market absorbed the enormity of the upside surprise.
Key lesson: The 2009 experience perfectly validates the certainty-versus-uncertainty framework. Pre-election, markets priced in hung parliament risk. The actual result was dramatically more decisive than expected — producing an explosion of relief and optimism as that uncertainty premium was removed.
The same principle that caused the 2004 crash caused the 2009 rally — except in reverse. Surprise uncertainty causes crashes. Surprise clarity causes rallies. The political colour of the winner is secondary.
2014 — The Landslide and the Bull Market
The 2014 General Election was perhaps the most anticipated market event in Indian history — and in this case, markets priced the expected result extremely aggressively in advance.
As the campaign progressed and pre-election surveys increasingly pointed toward a BJP-led NDA majority — and specifically toward the strong personal mandate for Narendra Modi — Indian equity markets began pricing in this outcome weeks before results.
The Sensex and Nifty rallied sharply through the election campaign period. Foreign institutional investors poured money into Indian equities on the anticipation of political change and economic reform. By the time results confirmed the expected NDA majority in May 2014, a significant portion of the post-election rally had already been delivered in anticipation.
The result confirmation produced further gains — but more modest than the pre-result rally — as the market had largely priced in the expected outcome. Indian markets went on to continue their upward trajectory through much of 2014 and into 2015 as economic optimism around the new government’s reform agenda drove valuations higher.
Key lesson: When markets have time to price in an expected election outcome, the pre-election rally absorbs much of the potential post-election gain. The best returns in election years often go to investors who are positioned before the consensus expectation becomes widespread — not to those who buy after the result is clear.
2019 — Pricing Continuity and the Policy Stability Premium
The 2019 General Election occurred in the context of an incumbent government seeking renewal — with significant pre-election uncertainty about whether the NDA would retain its majority or face a more contested result.
Markets initially fell in the months leading up to the election as global headwinds, domestic economic slowdown concerns, and election uncertainty created caution. As pre-election surveys increasingly pointed toward NDA retention — and a stronger mandate than many had expected — markets recovered and began pricing in continuity.
The actual result — a larger NDA majority than in 2014 — produced a positive market reaction on result day. The policy continuity signal was received positively. Infrastructure-linked companies, financial sector stocks, and domestic consumption names rallied on the expectation of continued economic reform momentum.
Key lesson: Continuity — the re-election of an incumbent government — is typically a more muted market positive than a new government with a fresh reform mandate. Markets already know the incumbent’s policy approach. There is less uncertainty to resolve and therefore less volatility premium to release on the upside.
2024 — The Coalition Surprise and Its Market Lesson
The most recent General Election in 2024 provided another powerful reminder of the certainty-versus-uncertainty dynamic that has characterised every Indian election cycle since liberalisation.
Going into results, pre-election surveys and exit polls had pointed toward a strong NDA majority — potentially larger than 2019. Markets had priced in this expectation. Volatility was relatively contained in the weeks before results as confidence in the expected outcome was high.
The actual result — while still delivering a third term for the NDA government — showed a significantly reduced majority compared to 2019, requiring coalition partner support in a way that 2019 had not. The deviation from expected outcome delivered a sharp short-term market correction on result day as markets repriced the reduced mandate and increased coalition dynamics.
The market subsequently recovered as clarity emerged about government formation and policy direction — validating once again the temporary nature of election-surprise volatility.
Key lesson: No election is entirely predictable. Pre-election surveys and exit polls have consistently — across multiple cycles — failed to perfectly call the magnitude of outcomes. Investors who build large portfolio positions based on election outcome predictions are taking risks that historical accuracy rates of those predictions do not justify.
The Patterns That Are Real — Distilling the Historical Evidence
Across more than three decades of Indian election history, several genuinely reliable patterns emerge from the noise.
Pattern 1 — Pre-Election Rally Followed by Volatility Around Results
In most Indian General Election cycles, the market tends to rally in the months leading up to election results — as the government in power typically accelerates spending, announces populist schemes, and creates a positive economic backdrop to support its re-election campaign.
This pre-election spending surge — reflected in infrastructure projects, agricultural support, welfare programs, and consumption stimulus — creates genuine economic momentum that stock markets price positively.
The rally is then followed by sharp volatility around result announcement — in either direction — depending on whether the actual result matches, exceeds, or disappoints expectations.
Pattern 2 — The Post-Election Mean Reversion
Regardless of which party wins — and regardless of whether the result day produces a rally or a crash — Indian markets have historically returned to being driven by fundamental economic factors within 3 to 6 months of election results.
The 2004 crash recovered within months. The 2009 rally was followed by a period of more measured returns. The 2014 and 2019 post-election moves were eventually overtaken by broader global and domestic economic factors.
Elections matter for short-term market movements. They matter far less for 3 to 5 year equity returns, which are ultimately determined by corporate earnings growth, interest rates, global liquidity, and macroeconomic fundamentals — not by which party won the election.
Pattern 3 — Majority Governments Are Preferred Over Coalitions
This pattern is consistent across every Indian election cycle. Markets react more positively to decisive majority mandates — which signal policy clarity, reform capability, and government stability — than to coalition governments that require ongoing negotiation and compromise.
This is not a preference for any specific political party. The 2009 UPA majority was welcomed as enthusiastically as any BJP majority. What markets prefer is clarity of mandate — the ability of any government to make and implement economic decisions without being constrained by coalition arithmetic.
Pattern 4 — State Elections Create Sector-Specific Opportunities
Major state elections — particularly in large states — create predictable sector-specific patterns that observant investors can use.
Infrastructure spending typically accelerates ahead of state elections in the incumbent state. Agricultural loan waivers — announced ahead of rural-heavy state elections — affect banking sector stocks. Schemes targeting specific voter segments create near-term demand tailwinds for related sectors.
These state election effects are more muted and shorter-lived than General Election effects — but they are real and can create tactical opportunities for investors paying attention.
Pattern 5 — Election Year Volatility Creates Buying Opportunities
Perhaps the most consistently actionable pattern across all Indian election cycles is this — the volatility that elections create, particularly on surprise result days, has historically represented buying opportunities rather than selling triggers for long-term investors.
Every major election-related crash in Indian market history — 2004 result day, the various coalition collapse episodes of the 1990s, the 2024 result day correction — proved to be temporary. Investors who sold during the panic locked in losses. Investors who bought during the panic generated exceptional subsequent returns.
This does not mean elections cannot trigger sustained downturns. A truly catastrophic political outcome — one that fundamentally threatens property rights, contract enforcement, or macroeconomic stability — could justify a sustained market decline. But India has never experienced such an outcome since liberalisation, and the historical base rate of election corrections being buying opportunities is extremely high.
The Myths — What People Believe That Data Does Not Support
Having established what the data shows, it is equally important to address what it does not show — the myths that persist in Indian financial media and investor discourse despite having no reliable historical support.
Myth 1 — “Markets always rally before elections”
False. Markets rally before some elections — particularly when pre-election surveys are pointing toward an expected, market-friendly outcome and when pre-election government spending creates economic momentum. But markets have also fallen in pre-election periods — 2019 saw significant pre-election weakness before recovering — and the pattern is not reliable enough to form the basis of a trading strategy.
Myth 2 — “A BJP win is always good for markets, Congress bad”
Completely false — and the data is unambiguous. Indian markets delivered some of their strongest multi-year returns under Congress governments. The UPA period from 2004 to 2008 — before the global financial crisis — was one of the greatest Indian equity bull markets in history, delivering Sensex returns that exceeded almost any BJP-era period. Markets respond to policy content and economic conditions — not to party labels.
Myth 3 — “You should sell before elections and buy after”
This strategy — which sounds intuitive given that elections create uncertainty — has historically been wrong in more cases than it has been right. The pre-election rally means that investors who sell early miss significant gains. The post-election volatility on result day is too short-lived and unpredictable in direction to reliably time. Long-term investors who simply stayed invested through election cycles have consistently outperformed those who tried to time around them.
Myth 4 — “The stock market predicts who will win elections”
This is perhaps the most pernicious myth. The stock market prices expectations about policy outcomes — not actual election results. When expectations are wrong — as they were in 2004 — the stock market that appeared to be predicting one outcome is simply wrong. Markets are not crystal balls. They are collective expectations — and collective expectations fail regularly.
What This Means for Your Portfolio — Practical Guidance
Having examined three decades of history, what should individual Indian investors actually do with their portfolios in the context of election years?
Do not change your long-term investment strategy based on election predictions
The data is clear — investors who make significant portfolio changes based on election outcome predictions consistently underperform those who maintain disciplined long-term strategies. The uncertainty of actual outcomes relative to predicted outcomes is too high, and the temporary nature of election-driven volatility is too well established, to justify disrupting a sound long-term investment plan.
Use election-related volatility as an opportunity rather than a threat
Build a watchlist of high-quality stocks and funds that you want to own but consider slightly expensive at current prices. Election-related corrections — particularly on surprise result days — often bring these assets to more attractive entry points temporarily. Having a pre-approved list and pre-allocated capital allows you to act decisively rather than deliberating while the window is open.
Increase cash allocation modestly — not dramatically — heading into results
Holding slightly more cash than usual in the weeks around result announcement — perhaps 5 to 10 percent of portfolio versus normal levels — gives you both protection against downside surprise and ammunition to deploy into any sharp correction. This modest tactical adjustment is different from the wholesale portfolio restructuring that most election-noise-driven investors are tempted to make.
Pay more attention to policy specifics than party labels
After any election result — regardless of which party wins — the most important investment question is what the new government’s actual economic policies will be on fiscal management, infrastructure spending, financial sector regulation, and foreign investment. These policy specifics determine sector-level opportunities far more reliably than the party label does.
Continue SIPs without interruption
For investors in systematic investment plans — mutual funds or stock accumulation plans — the mathematically correct behaviour through election volatility is to continue investing without interruption. The rupee cost averaging benefit of buying at lower prices during election-related corrections is real and cumulative.
The Bigger Picture — Why Elections Matter Less Than You Think for Long-Term Returns
The most important perspective to carry out of this article is one that contradicts the enormous attention Indian financial media lavishes on election-market relationships.
Over 10 and 20-year investment horizons — the timeframes that matter for genuine wealth creation — elections are remarkably small contributors to total return outcomes.
The investors who put money into Indian equities in 2004 — on result day, during the panic crash — and held for ten years, lived through three different government configurations. Congress minority, Congress majority, BJP majority. Their ten-year returns were extraordinary regardless of their views on any of those governments.
The investors who put money into Indian equities in 2009 — again, choosing almost the worst possible single-day entry from a political panic perspective — and held for ten years, also generated exceptional wealth.
What drove those returns was not election results. It was corporate India’s earnings growth, India’s economic development trajectory, the power of compounding over long periods, and the simple discipline of staying invested through the inevitable uncertainty and volatility that is part of every market cycle.
Elections create noise. They create opportunity for those who understand the patterns. And they create danger for those who let political sentiment override investment discipline.
The most powerful thing you can do in an election year is exactly what you do in every other year — invest consistently in quality, manage risk carefully, maintain a long-term perspective, and resist the enormous pressure to make dramatic changes based on political prediction.
The market has rewarded that approach in every election cycle in Indian history.
There is no reason to believe the next one will be any different.
Disclaimer: This article is for educational and informational purposes only and does not constitute financial or investment advice. Historical market patterns do not guarantee future results. Political and economic conditions change — past election cycle patterns may not repeat in future cycles. Always consult a SEBI-registered financial advisor before making investment decisions.